Showing posts with label Celsius. Show all posts

Sunday, November 5, 2017

Chapter 6.2 - The Kelvin scale for measuring Temperature

In the previous section we saw the details about the Celsius scale and the Fahrenheit scale to measure temperatures. In this section we will see another scale.

• Recall the rod in fig.6.4 on which various temperatures were marked. 
• Now, a third group of scientists walk upto the rod and add some more details. The new details that they added are shown in magenta color in fig.6.14 below:
Fig.6.14
• We can see that, 273o K is marked at A. Also 373o K is marked at B. What do they mean? 
• Ans: They have used a third scale. It is called the kelvin scale. 
    ♦ In that scale, the heat content corresponding to the freezing point of water is given the value: 273.
    ♦ And the heat content corresponding to the boiling point of water is given the value 373. 
• So this scale is similar to the Celsius scale. because, there are exactly 100 units between freezing point of water and boiling point of water. 
• Because of this similarity in units, we can easily convert from Celsius to kelvin and vice versa. Let us see an example:
• The normal human body temperature is 37o C. Find how much it is in the kelvin scale?
Solution:
1. 37o C is 37 units above zero in the Celsius scale
2. The units in Celsius and Kelvin scales are of the same magnitude. Also, corresponding to zero in the Celsius scale, we have 273 in the kelvin scale.
3. So the required value is 37 units above 273 in the kelvin scale  
4. Thus we have: 37o C = (273 + 37)o K = 310o K

From this problem, we get a general method:
• If C is the given temperature in the Celsius scale, and K is the required temperature in Kelvin scale, we can write:
Eq.6.4:
K = 273 + C
• This equation can be rearranged to obtain C, if we are given K. That is:
Eq.6.5:
C = K - 273

• Before we proceed to the next topic, we have to learn one more detail about the kelvin scale. 
• In the fig.6.14, note the value of 0o K written at the left most end of the rod. It is a new point 'C'.
• According to the Kelvin scale, 0o K is the lowest possible temperature. 
    ♦ At this temperature, the kinetic energy of the molecules become zero. 
    ♦ This temperature is also called the absolute zero. 
• Let us convert this absolute zero into Celsius scale:
1. From Eq.6.5, we have: C = K - 273.
2. The given temperature in K = absolute zero = 0o K
3. Substituting this in (1), we get: C = 0 - 273 = -273o C
• The precise value of absolute zero is -273.15o C
4. So the temperature in Celsius scale, corresponding to absolute zero is -273o C
• We can get a rough idea about 'how cold -273 C is' by considering the following facts:
    ♦ Carbon dioxide becomes solid to form dry ice at -78.5o C
    ♦ Oxygen turns from gaseous state to liquid state at -183o C

• Now let us see 'how much is absolute zero in the Fahrenheit scale':
1. We have: absolute zero = 0o K = -273.15o C
2. All we need to do is: Convert this C into F
We can use Eq.6.2:
F = [(9⁄5)×C  + 32] =
3. Substituting the given value of C, we get:
F = [(9⁄5)×(-273.15)  + 32] = -491.67 + 32 = -459.67o F


We can add these details to fig.6.14 that we saw above. The modified fig.6.15 is shown below:
Fig.6.15


Solved example 6.3
What are the following temperatures in the Celsius scale?
(a) 491.67o F (b) 673 K
Solution:
Part 1:
1. In this problem, we have to convert from Fahrenheit to Celsius. We can use Eq.6.3:
C = (5⁄9)×[F-32]
2. Substituting the given value of F, we get:
C = (5⁄9)×[491.67-32] = (5⁄9)×[459.67] = 255.372o C   
Part 2:
1. In this problem, we have to convert from Kelvin to Celsius. We can use Eq.6.5:
C = K - 273
2. Substituting the given value of K, we get:
C = 673 - 273 = 400o C


In the next section, we will see Specific heat capacity.

PREVIOUS        CONTENTS          NEXT


Copyright©2017 High school Physics lessons. blogspot.in - All Rights Reserved

Chapter 6.1 - Conversion between Celsius and Fahrenheit scales

In the previous section we saw that the freezing point of water is marked as 0 C in the Celsius scale and 32 F in the Fahrenheit scale. In this section we will continue to closely follow the works of the scientists.

13. The scientists continued their work:
• The first group of scientists marked a point B at some distance to the right of A. At that point B, they wrote: 100o C. This is shown in fig.6.6 below:
Fig.6.6
• They said: 'The heat content at that point is just high enough to make water boil'
• 'Just high enough' means that, if we place water any where to the left of B, it will not boil'
14. Now, the second group of scientists wrote 212o F at the point B. This is shown in fig.6.7 below:
Fig.6.7
• They also said the same: 'The heat content at that point is just high enough to make water boil'
15. The 'quantity of heat' at the point B is the same. But the two groups of scientists used different systems of measurements. That is why we have two different values : 100 and 212 at the point B

• Now we want to find a relation between the two systems. We will find the relation in steps:
1. Note the peculiarities of the two points:
• At A, the heat is just low enough to make the water freeze
• At B, the heat is just high enough to make the water boil
2. So we are looking at a specific region to the right side of A and to the left side of B.
• That is., we are interested in the region between A and B
3. Let us first consider the Celsius scale.
• We have zero at A and 100 at B
• Let us divide the region between A and B into 100 equal parts. So each part will be equivalent to 1o C. This is shown in the fig.6.8 below:
Fig.6.8
• In the fig., it is divided into 10 equal parts. This is for clarity. If we divide each of these parts further into 10 equal parts, we will get exact 100. But then the fig. will become crowded. For our present discussion, it is sufficient to base our discussion on 10 equal parts
■ Consider any two consecutive marks. Say 30 and 40 
• We come to an important question:
■ What is the difference in the heat content between these two marks?
The question can be elaborated:
■ We know that 40 will be having a higher heat content than 30. But how much more heat is available at 40?
Let us find the answer:
• Consider the graph shown in fig.6.9 below. The magenta line is the graph showing uniform increase in the heat. 
Fig.6.9
• Consider the red vertical lines corresponding to the points 10 and 20. The two red lines are of the same height. 
• The height of these two red lines will give the heat content at point 10. But at 20, the heat content will be more than that at 10. So the red line is not enough for the heat at 20 
    ♦ That is., when compared to 10, some 'extra heat' is available at 20.  
• A small white vertical line is drawn above the red line at 20. This white line is the 'extra heat' available at 20. 
• In the same way, the small white line at 40 is the extra heat available at 40, when compared to the heat at 30. 
• The small white line at 80 is the extra heat available at 80, when compared to the heat at 70. 
• We can see that, all the small white lines are of the same height. This can be proved mathematically using some very basic properties of triangles. The reader may try it himself/herself. 
    ♦ We can prove it for any two consecutive points. 
■ So we get an important result: The 'difference in heat content' between any two consecutive points is the same.
• The 'same difference' is obtained because two conditions are satisfied:
    ♦ The magenta coloured graph is a straight line without any bends or curves
    ♦ The 10 divisions between zero and 100 are all equal
• If both these conditions are not satisfied, we will not get the 'same difference'.

Based on this information, we can see the principle of a thermometer.
Consider the thermometer (Celsius scale) shown in fig.6.10 below:
Fig.6.10
• The bulb at the lower end is a reservoir for mercury.
• This bulb is brought into contact with the point at which temperature is to be measured.
• The heat is then transferred from that point to the mercury.
• The mercury then expands and rises up through the inner tube. Thus we will get the readings
• Suppose that the bulb is brought in contact with the '30 mark' in our rod in fig.6.9 above. Then the mercury in fig.6.10 will rise upto the 30o mark. 
• Next, the bulb is brought into contact with the '40 mark' in our rod in fig.6.9.
• Here the heat content is more. So more heat will flow into the mercury. The mercury will expand further and reach the 40o mark.
• Next, the bulb is brought into contact with the '50 mark' in our rod in fig.6.9.
• Here the heat content is more. So more heat will flow into the mercury. The mercury will expand further and reach the 50o mark.
• Now, the 'extra heat' between 30 and 40 in fig 6.9 caused the mercury to rise up from 30o to 40o in fig.6.10
• We have seen that in fig.6.9, 'extra heat' between 30 and 40 will be same as the 'extra heat' between 40 and 50
• So, the following two quantities are the same:
    ♦ amount of expansion from 30 to 40
    ♦ amount of expansion from 40 to 50
This is shown in the fig.6.11 below:
Fig.6.11
So the markings in the thermometer should be at equal intervals

■ Now we will continue with the main discussion: To find the relation between Celsius scale and Fahrenheit scale.
4. We will show the Fahrenheit scale also along with the Celsius scale. So the fig.6.8 above has to be modified. The modified fig.6.12 is shown below:
Fig.6.12
5. Note the peculiar way in which the markings are made in the Fahrenheit scale.
• The region between 32 and 212 is divided into 10 equal parts.
• But the divisions are marked as 50, 68, 86, . . . Instead of 50, 60, 70, . . . 
• Why is this so?
We have: 
• In the Celsius scale, (boiling point - freezing point) = (100 - 0) = 100 
• In the Fahrenheit scale, (boiling point - freezing point) = (212 - 32) = 180
• So the region between 0 and 100 in the Celsius scale is divided into 100 equal parts
• In the same way, the region between 32 and 212 in the Fahrenheit scale must be divided into 180 equal parts
    ♦ For getting 180 equal parts, the region is first divided into 10
    ♦ Then each of these 10 is further divided into 18 equal parts
• So the first mark after 32 is (32+18) = 50. The mark after 50 is (50+18) = 68
and so on . . .
• The two thermometers can be shown together as below:
This fig. is taken from wikimedia commons. The original can be seen here.
6. Let Qc be the quantity of heat required for the rise in each small unit in the Celsius scale
• Then total heat quantity from 0o C to 100o C = Qc ×100 = 100 Qc
7. Let Qf be the quantity of heat required for the rise in each small unit in the Fahrenheit scale
• Then total heat quantity from 32o F to 212o F = Qf ×180 = 180 Qf
8. The quantities in (6) and (7) are the same. So we can write:
Eq.6.1:
100 Qc = 180 Qf
⇒ 5 Qc = 9 Qf ⇒ Qc = (9⁄5) Qf
9. From this result, we can note some interesting points:
• In the Celsius scale, the region is divided into 100 equal units. But in the Fahrenheit scale, the same region is divided into 180 equal units 
• So the units in the Fahrenheit scale will be smaller than the units in the Celsius scale. 
• We find that this is true when we see the result in (8): Qf is to be multiplied by a factor which is 'greater than 1' to get Qc
10. The result in (8) is the basic relation between the two scales. We can use it to convert from one scale to another. Let us see an example:
• The Celsius thermometer in a room indicates that the temperature in that room is 28o C. How much is it in Fahrenheit?
Solution:
1. The reading is 28o C. So it is 28 units above zero in the Celsius scale
2. The value corresponding to 0o C in the Fahrenheit scale is 32o F. 
3. Since 28 is above zero, the reading corresponding to 28 in the Fahrenheit scale will be above 32
• We want to know 'how many units' above 32
4. We have seen that each unit in Fahrenheit scale is smaller than the units in Celsius scale. 
• So the heat producing a rise of one unit in Celsius scale will produce a rise of more than one unit in Fahrenheit scale. We have seen that it is (9⁄5) times
• So the rise of 28 units in the Celsius scale will cause a rise of [28 × (9⁄5)] = 50.4 units in the Fahrenheit scale
5. The '28 units' is above zero in the Celsius scale
• So the '50.4 units' is above 32 in the Fahrenheit scale
• Thus the reading in Fahrenheit scale is (32+50.4) = 82.4 F

Based on this example we can write a general form:
If C is the reading in Celsius scale, the corresponding reading in Fahrenheit scale will be [32 + (9⁄5) × C]    
So if F is the reading corresponding to C, we can write:
Eq.6.2:


Next we will see how to convert Fahrenheit to Celsius. Here also we will use an example

• The Fahrenheit thermometer in a room indicates that the temperature in that room is 95o F. How much is it in Celsius?
Solution:
1. The reading is 95o F. So it is (95-32) = 63 units above 32 in the Fahrenheit scale
2. The value corresponding to 32o F in the Celsius scale is 0o C. 
3. Since 95 is above 32, the reading corresponding to 95 in the Celsius scale will be above 0
• We want to know 'how many units' above 0
4. Let it be 'C' units above zero
5. We have seen that each unit in Fahrenheit scale is smaller than the units in Celsius scale. 
• So the heat producing a rise of one unit in Celsius scale will produce a rise of more than one unit in Fahrenheit scale. We have seen that it is (9⁄5) times
• So the rise of C units in the Celsius scale will cause a rise of [C × (9⁄5)] units in the Fahrenheit scale
6. In this example, [C × (9⁄5)] = 63 = (95-32) = (F-32)
So C = 63 × (5⁄9) = 35
7. In the above step, 63 = (95-32) = [(given value of F)-32] 
So we can write a general form:
C = (F-32)× (5⁄9) 
• This can be written as:
Eq.6.3:


Note that, the above equation can be obtained by rearranging Eq.6.2 also


Let us see a few solved examples:
Solved example 6.1
The normal human body temperature is 98.6o F. How much is this in the Celsius scale?
Solution:
1. In this problem, we have to convert from Fahrenheit to Celsius. We can use Eq.6.3:
C = (5⁄9)×[F-32]
2. Substituting the given value of F, we get:
C = (5⁄9)×[98.6-32] = (5⁄9)×[66.6] = 37o C    
Solved example 6.2
If the average temperature of a day is 30o C, how much will it be in Fahrenheit scale?
Solution:
1. In this problem, we have to convert from Fahrenheit to Celsius. We can use Eq.6.2:
F = (9⁄5)×C  + 32
2. Substituting the given value of C, we get:
F = (9⁄5)×30  + 32 = 54 + 32 = 86o F

Graphical method to convert from Celsius to Fahrenheit and vice versa

• Conversion between the two scales can be done using a graph also. Let us see the method:
• In fig.6.13 below, the Celsius scale is marked along the X axis and the Fahrenheit scale is marked along the Y axis. 
Fig.6.13
• We can take any convenient scale. In the fig.6.13, the following scales are used:
    ♦ Each unit along the X axis represents 10o C
    ♦ Each unit along the Y axis represents 20o F
• The first step is to mark the known points. We need at least two points to draw a line. We do have two such points: (0,32) and (100,212). These are shown with blue coloured 'x' marks
• The blue line joining those two points is our graph.
• Let us do some conversions. We will see the same solved examples 6.1 and 6.2
• 6.1: We want to convert 98.6o F to Celsius
• For that, draw a horizontal line through 98.6 on the Y axis. In the fig.6.13, it is the horizontal white colored dashed line (very close to 100 on the Y axis)    
• This line intersects the blue graph at a point.
• From the point of intersection, drop a vertical line. In the fig.6.13, it is the vertical white colored dashed line
• This line intersects the X axis at a point. This point of intersection is our required point. If we zoom in, we will find that it is (37,0). So 37o C is equivalent to 98.6o F
• 6.2: We want to convert 30o C to Fahrenheit
• For that, draw a vertical line through 30 on the X axis. In the fig.6.13, it is the vertical mgenta colored dashed line (through 30 on the X axis)    
• This line intersects the blue graph at a point.
• From the point of intersection, draw a horizontal line to the left. In the fig.6.13, it is the horizontal magenta colored dashed line
• This line intersects the Y axis at a point. This point of intersection is our required point. If we zoom in, we will find that it is (0,86). So 86o F is equivalent to 30o C

• After reading the basics about Fahrenheit scale, the reader may naturally wonder:
■ If 32 is the freezing point of water, what is zero?
• To find the answer, we have to look into some history:
• The Fahrenheit scale was invented by a German scientist Daniel Gabriel Fahrenheit., who lived and worked in Amsterdam, Netherlands.
• He invented the scale in the 1720s. At that time, the lowest temperature achievable in his laboratory was the temperature of a 'special mixture'.
• It was a mixture of salt, water and ammonium chloride. It had a heat content much lower than the freezing point of ordinary water.
• As it was the lowest possible temperature, he assigned the number 'zero' to it.

In the next section, we will see the Kelvin scale.

PREVIOUS        CONTENTS          NEXT


Copyright©2017 High school Physics lessons. blogspot.in - All Rights Reserved

Saturday, November 4, 2017

Chapter 6 - Heat

In the previous section we completed a discussion on wave motion. In this section we will discuss some basic details about Heat.
• Matter exists mainly in three states: Solids, Liquids and Gases. 
• The building blocks of all material are molecules. It is interesting to know how these molecules are placed inside the materials. Let us analyse:
1. In solids, the molecules are rigidly held in positions. That means they cannot move from their positions. 
• This is because, the inter molecular attractive forces are very high in solids. 
• Also, the molecules in solids are very closely packed. That means, the distances between molecules in solids are very small. 
2. In liquids, the molecules are not rigidly held in positions. So they can move from their positions. 
• This is because, the inter molecular attractive forces are low in liquids. 
• Also, the molecules in liquids are not very closely packed. The distances between molecules in liquids are greater than that in solids. 
3. In gases also, the molecules are not rigidly held in positions. So they can move from their positions.
• This is because, the inter molecular attractive forces are low in gases. These forces are so low that, the molecules of gases have greater freedom than the molecules of liquids
• Also, the molecules in gases are not very closely packed. The distances between molecules in gases are greater than that in solids and liquids.

■ The molecules of all matter are always in a state of motion.
• Even the molecules of solids are always in a state of motion. 
• Hence all the molecules possess kinetic energy. 
• Let us consider the three states of water. 
1. In the solid state, it is ice. When the water becomes ice, it is a solid. 
• The molecules of ice are rigidly held in position. The freedom of motion is very low. 
• Even in such a condition, they possess kinetic energy. But this kinetic energy will be very low.
2. In the liquid state, water molecules have a greater freedom of motion. 
• So they possess a little more kinetic energy than in solids
3. In the gaseous state, water is water vapour. The molecules have very large freedom of motion. 
• So the kinetic energy will also be very large.

Let us do an experiment to understand the relation between heat and kinetic energy. The steps are given below:
1. Wrap some potassium permanganate and a small piece of stone using plastic coated paper. 
• Make one more such packet. 
2. Put small holes in both the packets using a needle. 
3. Take some hot water in one beaker and cold water in another beaker.
• The quatities of water must be the same in both the beakers. 
4. Put the prepared packets into the beakers at the same time. 
• We can see that the colour of the potassium permanganate spreads in the hot water quickly. See fig.6.1 below:
Fig.6.1
• How can we explain this observation?
The explanation can be given in steps: 
(i) In hot water, the molecules have greater kinetic energy. So they have greater speeds. 
(ii) Because of the greater speeds that they possess, they can reach greater distances in lesser time. 
(iii) So the molecules of the potassium permanganate spreads out to a larger area with in a short span of time. 
4. This is not possible in cold water. In it, the molecules will travel only slowly. 
Conclusion:

When any substance is heated, the speed of motion of molecules in that substance increases. So kinetic energy of those molecules increases.

Another experiment:

1. Take equal amount of water in two beakers. 
2. Heat one of them for some time. 
3. Now touch the water in both beakers. 
• We can see that water in the heated beaker is at a higher temperature. 
• This is because, the water in the heated beaker absorbed heat energy. 
• When heat energy is absorbed, the kinetic energy of the water molecules increases 

• But all the molecules in the hot water beaker will not be having the same kinetic energy.
    ♦ The molecules which are near the source of heat (the spirit lamp or burner) will be having a greater kinetic energy
    ♦ The molecules which are away from the source of heat will be having a lesser kinetic energy
    ♦ The molecules which are at an intermediate distance from the source of heat will be having an intermediate kinetic energy.
• Thus comes the need for mentioning an 'average kinetic energy' 

So we will see Total kinetic energy and Average kinetic energy:
1. Let the total kinetic energy of the cold water be k1
2. Let the total kinetic energy of the hot water be k2
3. It is clear that k2 is greater than k1
4. The number of molecules in both the beakers are the same. Because we took equal amount of water in both beakers. Let this number be 'n'. 
5. So average kinetic energy in cold water = k1⁄n
• average kinetic energy in hot water = k2⁄n
6. The denominators are the same. And k2 > k1. So we get:
■ Average kinetic energy in hot water is greater than average kinetic energy in cold water.

• For measuring the 'quantity of heat', we need a physical quantity. The physical quantity that we use for this purpose is temperature.
• 'Temperature' is related to 'quantity of heat' in the same way as 'volume' is related to 'quantity of space'. 
• Let us see an example:
1. Consider the box shown in fig.6.2(a) below:
Fig.6.2
2. A group of students walk upto the box and take it's measurements. They note down the measurements and do some calculations. 
3. Then they write down the result: Volume of the box is 0.0394 cubic meter.
4. Now, another group of students from another part of the world, walk upto the box and take it's measurements. They note down the measurements and do some calculations. 
5. Then they write down the result: Volume of the box is 1.39 cubic feet.
6. The volume of the box remains the same. 
• The two different values (0.0394 and 1.39) are obtained because they used two different system of units. 
    ♦ The first group of used the SI system of units. 
    ♦ The second group used the Imperial system.
7. What ever system is used, the 'quantity of space' or the 'volume' occupied by the box does not change. 

1. Now consider the sphere shown in fig.6.2(b).
2. A group of scientists walk upto the sphere and measure it's temperature.
3. Then they write down the result: The temperature is 37 degrees Celsius.
4. Another group of scientists from another part of the world walk up to the sphere and measure it's temperature. 
5. Then they write down the result: The temperature of the sphere is 98.6 degrees Fahrenheit.
6. The 'quantity of heat energy' possessed by the sphere is the same. 
• The two different values (37 and 98.6) are obtained because they used two different system of units. 
    ♦ The first group of used the Celsius scale. The '37 degrees Celsius' can be abbreviated as: 37o C
    ♦ The second group used the Fahrenheit scale. The '98.6 degrees Fahrenheit' can be abbreviated as: 98.6o F
7. What ever system is used, the 'quantity of heat energy' possessed by the sphere does not change. 

■ But we have to learn the relation ship between the two systems: 'Degrees Celsius' and 'Degrees Fahrenheit'. Let us analyse:
1. Consider a solid rod shown in red colour in fig.6.3(a) below:
Fig.6.3
• It is made of a suitable material so that, it can withstand extreme temperatures. 
• That is., it can withstand 'very low temperatures' and also 'very high temperatures'. 
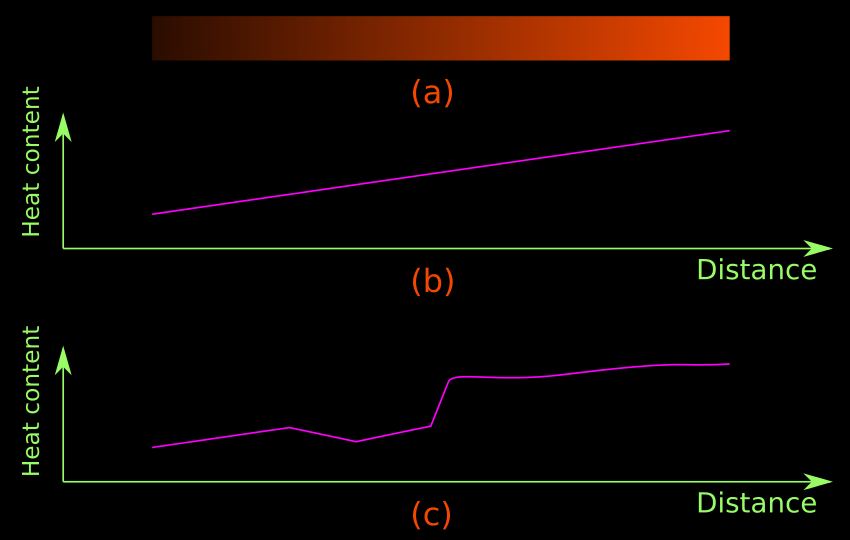
2. The rod in fig.6.3(a) is experiencing such extremes. 
• It's left end is at a very low temperature. 
• As we move to the right, the temperature increases gradually. 
• The 'increases in temperature' is uniform. So if we draw a graph, it will be a single straight line. This is shown in fig.6.3(b). 
• The graph shown in fig.(c) shows a non uniform increase. 
3. For our present discussion, the 'increase in temperature' is uniform. 
4. If we consider any particle along the length of the rod, that particle will have more heat than the particles on it's left side.
■ Now we will make a closer study on the rod. 
5. A group of scientists walk upto the rod. They measure the temperatures at various points along the length of the rod. 
6. Then they mark a point 'A' on the rod. Also at that point, they write '0o C'. It is shown in fig.6.4 below:
Fig.6.4
7. The onlookers asked them: 'Why mark 0o C at that point?' 
• The scientists replied: 'Because the heat content at that point is 'just low enough' to make water freeze'. 
    ♦ 'Just low enough' means that if we place water any where to the right of 'A', it will not freeze.
    ♦ The word 'just' is used on many occasions in physics. It indicates a 'border'.
8. The temperature at which water freezes is a 'good base mark'. We can relate all other temperatures to it. 
• Now the reader may wonder: The point 'A' is not at the exact left end of the rod. It is at some distance away from the left end. 
• That means the particles to the left of 'A' are colder than the freezing point of water. Are such colder temperatures possible?
• Of course they are possible. For example, 'dry ice' is colder than 'ice made from water'.
9. Now another group of scientists from another part of the world, walk upto the rod. They measure the temperatures at various points along the length of the rod. 
10. Then at the same point 'A', they write '32o F'. This is shown in fig.6.5 below:
Fig.6.5
11. The onlookers asked the same question as before: 'Why mark 32o F at that point?' 
• The reply was also the same as before: 'Because the heat content at that point is 'just low enough' to make water freeze'.
12. The 'quantity of heat at point A is the same. But the two groups of scientists used different systems of measurements. That is why we have two different values: 0 and 32 at the point A 
• The first group used the Celsius scale. 
• The second group used the Fahrenheit scale.

The scientists continued their work. We will see it in the next section.

PREVIOUS        CONTENTS          NEXT


Copyright©2017 High school Physics lessons. blogspot.in - All Rights Reserved